How to Effectively Measure Social Media Success: 5 KPIs to Track in 2026
|
8
min read

How to Effectively Measure Social Media Success: 5 KPIs to Track in 2026
Introduction
The social media landscape in 2026 looks dramatically different from just a few years ago. With AI-generated content flooding every platform, algorithm changes happening monthly, and new social channels emerging, MSME owners and marketing managers face an unprecedented challenge: how do you actually measure whether your social media efforts are paying off?
If you've ever felt overwhelmed by analytics dashboards or wondered whether your engagement numbers mean anything concrete, you're not alone. Many small business owners are swimming in data but starving for insights. The solution isn't more data, it's knowing which social media KPIs actually matter to your business.
In this article, I'll walk you through the 5 essential social media KPIs that will give you real insight into your performance. These aren't vanity metrics that look good in reports but fail to move the needle. These are the metrics that directly connect your social media activities to business outcomes. Whether you're a boutique owner, a digital agency, or a growing startup, you'll learn exactly what to track and how to use those numbers to make smarter decisions.
Let's dive into the metrics that will define successful social media strategies in 2026.
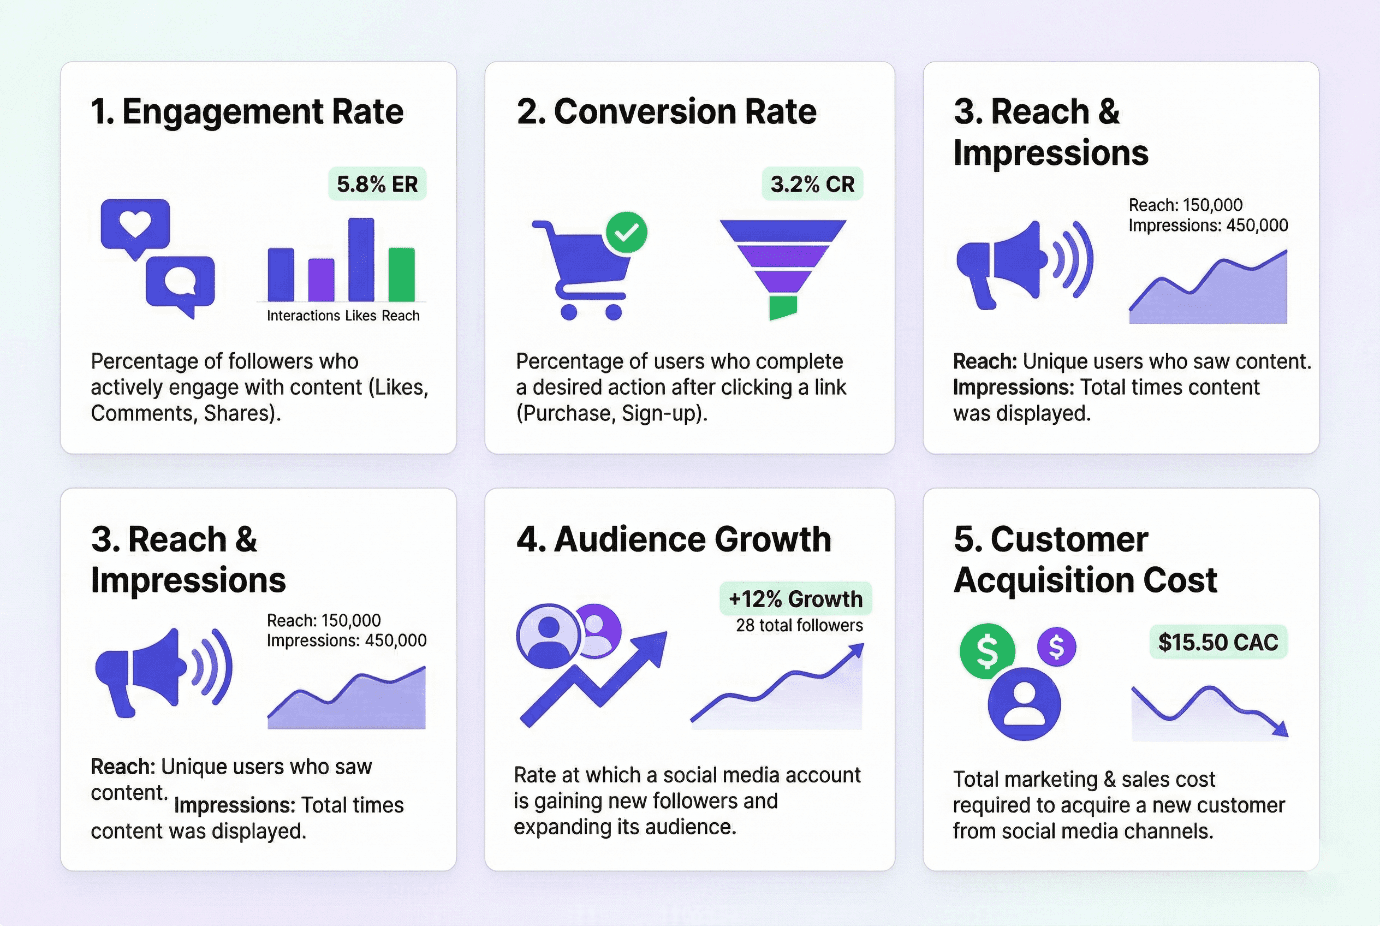
KPI 1: Engagement Rate
What It Is and How to Calculate
Engagement rate measures how actively your audience interacts with your content. It goes beyond simple likes to capture the actions that truly indicate interest: comments, shares, saves, and clicks. In 2026's crowded social landscape, engagement is one of the most reliable signals that your content resonates.
Engagement Rate = (Total Engagements ÷ Total Followers or Total Reach) × 100
For more precision, many marketers now use Public Engagement Rate, which calculates engagements relative to your actual reach rather than follower count, giving you insight into how non-followers interact with your content.
Why It Matters in 2026
In 2026, platform algorithms prioritize content that drives meaningful interactions. A post with high engagement gets more distribution, creating a virtuous cycle where great content reaches more people. For MSMEs, this means building an engaged community is often more valuable than accumulating passive followers.
Industry Benchmarks
Instagram: 1-3% average for business accounts
LinkedIn: 2-5% for B2B content
TikTok: 3-6% for accounts under 100k followers
Facebook: 0.5-1% for branded pages
Tips for Improvement
Ask questions in your captions to spark comments
Create carousel posts that encourage saves
Respond promptly to comments to boost interaction
Use trending audio and formats on TikTok and Reels
Post when your audience is most active
KPI 2: Conversion Rate
What It Is and How to Calculate
Conversion rate measures the percentage of social media users who take a desired action, whether that's purchasing a product, signing up for a newsletter, or downloading a resource. This is the metric that directly ties your social efforts to business revenue.
Conversion Rate = (Number of Conversions ÷ Total Clicks or Visitors) × 100
To track this effectively, you need proper UTM tagging on all your social links and conversion goals set up in your analytics platform. Using AI-powered analytics tools can automate much of this tracking and provide real-time insights into your conversion performance.
Connection to Business ROI
For MSME owners, conversion rate is perhaps the most critical KPI because it answers the fundamental question: is social media generating customers? While vanity metrics like follower counts feel good, conversion rate tells you whether your social strategy is actually supporting your business goals.
Tracking Methodology
Google Analytics 4 with UTM parameters
Platform-native conversion tools (Facebook Pixel, LinkedIn Insight Tag)
E-commerce platform analytics (Shopify, WooCommerce)
What Constitutes a Good Conversion Rate
Benchmarks depend heavily on your industry and conversion type:
E-commerce: 2-3% average conversion rate
B2B lead generation: 3-5% for landing pages
Email signups: 15-25% from social traffic
The key is establishing your own baseline and tracking improvement over time rather than comparing against industry averages that may not reflect your specific situation.
KPI 3: Reach and Impressions
Understanding the Difference
These terms are often used interchangeably, but they measure different things:
Reach: The total number of unique users who saw your content
Impressions: The total number of times your content was displayed (including multiple views by the same user)
Think of it this way: if your post appears in someone's feed three times, that's 3 impressions but only 1 reach. In 2026, understanding this distinction helps you diagnose whether your content is being seen by new people or just being shown repeatedly to the same audience.
Why Visibility Metrics Matter for Brand Awareness
For MSMEs building brand recognition, reach is foundational. You can't convert someone who's never heard of you. Reach metrics help you understand your brand's actual footprint in the market and whether your content is breaking through to new audiences.
The 2026 Context with AI-Generated Content
With AI content tools making it easier than ever to produce volume, the social landscape is saturated. This makes reach metrics even more valuable; they tell you whether your content is cutting through the noise or getting lost in the flood. Platforms are also increasingly favoring original, authentic content over purely AI-generated posts, so quality matters more than quantity.
How to Analyze Effectively
Track reach trends over time rather than focusing on individual post performance
Compare reach to follower count to understand viral potential
Monitor the impression-to-reach ratio to detect when content is being shown repeatedly
Use reach data to calculate cost per thousand impressions (CPM) for paid campaigns
KPI 4: Audience Growth Rate
Definition and Calculation
Audience growth rate measures how quickly your following is expanding. For sustainable social media success, you want consistent growth, but quality matters just as much as quantity.
Audience Growth Rate = ((Current Followers - Previous Followers) ÷ Previous Followers) × 100
Calculate this weekly or monthly to spot trends before they become problems.
Quality vs. Quantity of Followers
In 2026, a smaller engaged audience outperforms a large passive one every time. Algorithms prioritize content that generates interactions, and engaged followers are more likely to like, comment, share, and ultimately convert. A following of 5,000 genuinely interested followers is worth more than 50,000 who never engage.
Sustainable Growth Benchmarks
Healthy growth rates vary by platform and account size:
Instagram: 3-5% monthly growth for small accounts
LinkedIn: 2-4% monthly for B2B pages
TikTok: 5-10% monthly for growing creators
Anything significantly above these rates may indicate viral success or potentially fake follower activity that will hurt your engagement long-term.
Connection to Algorithm Rankings
Most social platforms factor follower growth into their ranking algorithms. Consistent, organic growth signals to platforms that your content is valuable and worth surfacing to more users. Sudden spikes from viral posts are great, but sustainable growth tells algorithms you're worth investing in.
KPI 5: Customer Acquisition Cost (CAC)
Definition and Calculation
Customer Acquisition Cost measures how much you spend to acquire each new customer through social media. This is the metric that answers whether your social media investment makes financial sense for your business.
CAC = Total Social Media Marketing Costs ÷ Number of New Customers Acquired
Include all relevant costs: ad spend, content creation, tools, and even the time value of your team's efforts.
Why CAC Is Critical for Business Owners
For MSME owners, understanding CAC is essential for sustainability. If it costs you more to acquire a customer than they're worth, your business model isn't viable—no matter how good your engagement numbers look. CAC tells you whether your social media strategy is a profit center or a money pit.
CAC to LTV Ratio Explanation
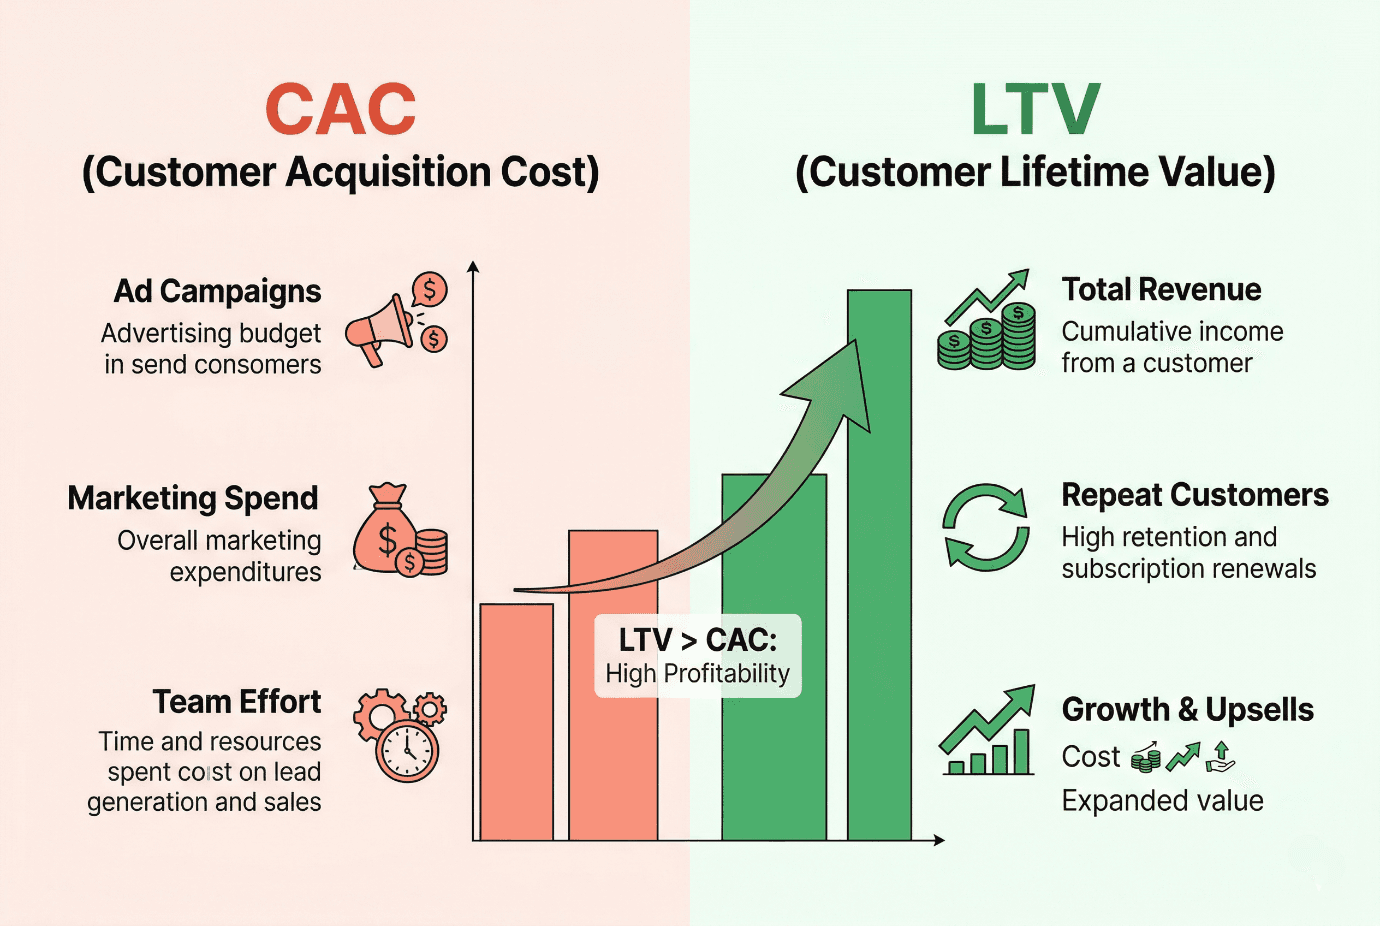
The real power of CAC emerges when you compare it to Customer Lifetime Value (LTV), the total revenue a customer generates over their relationship with you. The ideal scenario is a CAC to LTV ratio of 1:3 or better, meaning you spend one dollar to acquire a customer who generates three dollars in lifetime value.
LTV = Average Order Value × Purchase Frequency × Customer Lifespan
Optimization Strategies
Improve targeting to reduce wasted ad spend
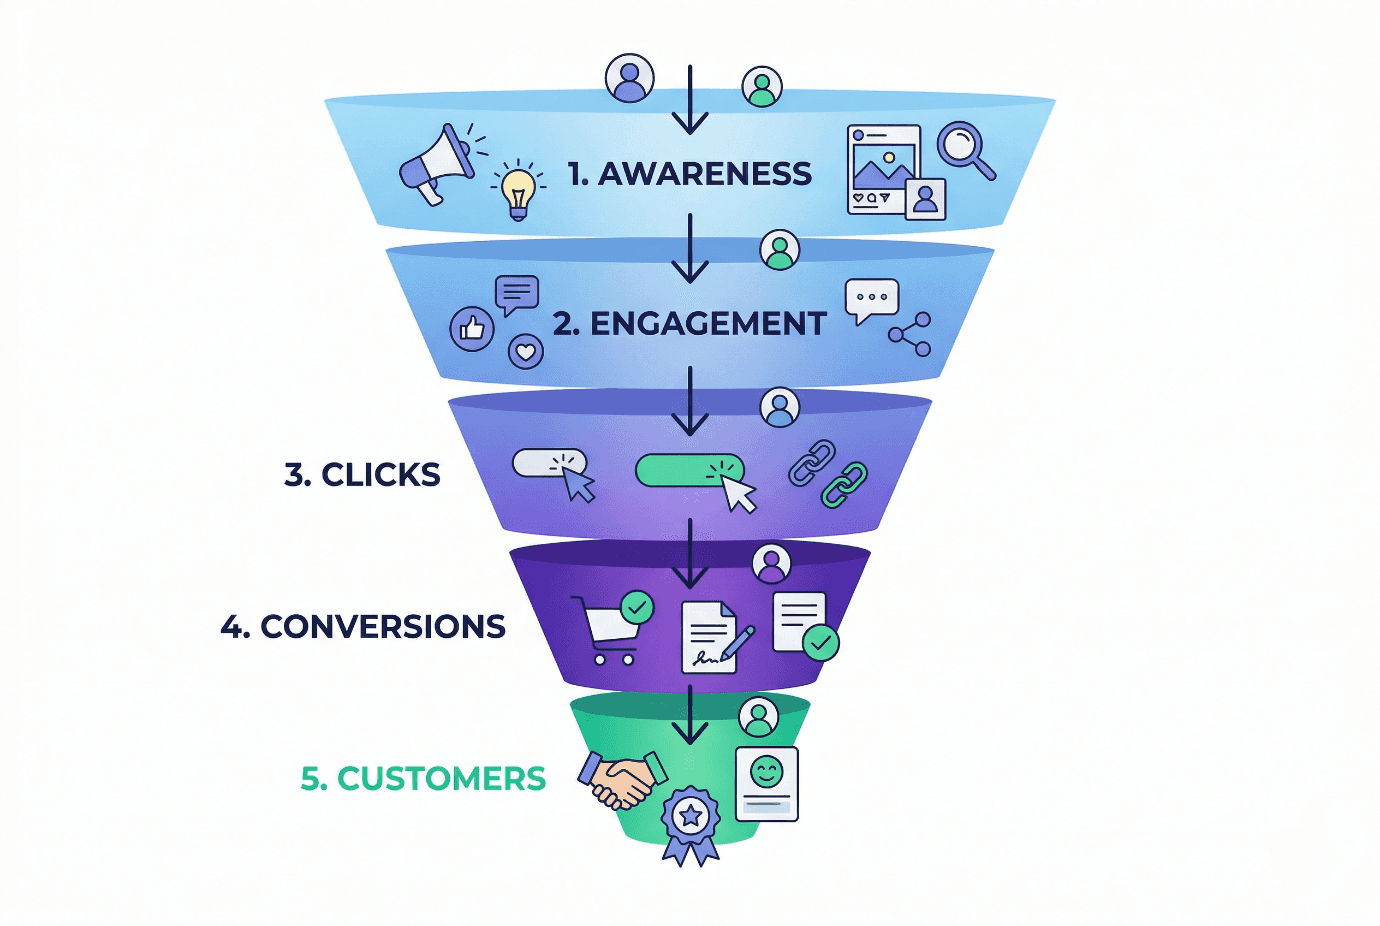
Create content that nurtures leads through the funnel
Implement retargeting campaigns for warm audiences
Test different platforms to find your lowest-CAC channel
Optimize landing pages to improve conversion rates
Conclusion: Your Social Media Success Checklist
Quick Action Steps
Choose 2-3 KPIs that align with your specific business goals
Set up proper tracking with UTM parameters and conversion goals
Establish baseline metrics before making changes
Review your KPIs weekly and adjust strategy monthly
Focus on engagement quality over follower quantity
Calculate your CAC and compare it to customer LTV
Test, measure, iterate, social media success is a continuous journey
Key Takeaways
The five KPIs covered, engagement rate, conversion rate, reach and impressions, audience growth rate, and customer acquisition cost, form the foundation of effective social media metrics measurement. Each serves a specific purpose: engagement shows content resonance, conversion demonstrates business impact, reach indicates brand building, growth reveals sustainable momentum, and CAC proves financial viability.
Remember that the best KPI strategy isn't about tracking everything, it's about tracking the metrics that matter most to YOUR specific business objectives. Start with one or two metrics, master those, then expand your measurement framework.
Tools like Sociali.ai make this process much easier by bringing all your KPIs into one simple dashboard. Instead of switching between platforms, you can track performance, generate reports, and make decisions faster—all in one place.
Disclaimer
Results vary significantly based on industry, target audience, content quality, and execution consistency. The benchmarks and strategies in this article represent general guidelines; your actual results may differ. Always adapt these recommendations to your unique business context.
Ready to streamline your social media analytics? Sociali.ai offers powerful tools designed specifically for MSME owners and marketing managers. Track your KPIs in one dashboard, generate automated reports, and make data-driven decisions without the complexity. Start your free trial today and turn your social media data into actionable insights.
Frequently Asked Questions (FAQs)
What are the most important social media KPIs in 2026?
The most important KPIs include engagement rate, conversion rate, reach, audience growth rate, and customer acquisition cost (CAC). These metrics help you understand both performance and business impact.
How do I track conversions from social media?
You can track conversions using tools like Google Analytics with UTM parameters, platform tracking pixels, and analytics dashboards to measure actions like purchases, sign-ups, or downloads.
Why is customer acquisition cost (CAC) important in social media marketing?
CAC helps you understand how much it costs to acquire a new customer through social media. It ensures your marketing efforts are profitable and aligned with your overall business goals.
Free resource
Get the checklist


